First shift
An experienced crew and a lead who runs a daily tier meeting
- Right-first-time
- 79%
- Operators under six months
- 2 of 21
- Charges weighed
- 98%
Case study · Sample site assessment
A sealants and adhesives plant took on 22% more volume as its private equity owner consolidated production. First shift kept making good batches. Second shift's right-first-time fell from 77% to 64%. Our site assessment traced the gap to four steps on the floor and showed how to close it in 90 days.
Sample deliverable. This case study and report are a composite. Company names, people, locations, and figures have been changed to protect client confidentiality.
| Category | Four-hour blocks |
|---|---|
| Productive mixing | 216 |
| Cleaning | 60 |
| Adds and re-tests | 50 |
| Waiting for QC | 36 |
| Waiting for materials | 28 |
| Idle | 30 |
The situation
Calder Falls makes more than half of the platform's volume and took in two product lines from a closed site. The formulas, vessels, and instructions are the same on every shift. The results are not.
An experienced crew and a lead who runs a daily tier meeting
Lost its lead to retirement in January and 41% of its operators in a year
Why do the same formulas come out different from shift to shift?
Asked by the platform's COO, with three follow-on questions:
What we found
Four views of the same plant, from the quality numbers back to the floor.
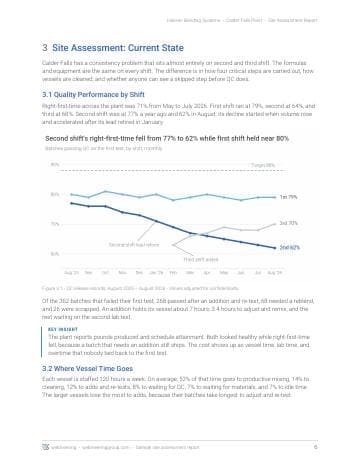
First shift held near 80% right-first-time all year. Second shift fell from 77% a year ago to 64% over the last quarter as volume rose and its lead retired. The plant tracked pounds produced, and a batch that needs an addition still ships, so the drop stayed hidden.
Each vessel is staffed 120 hours a week. About half goes to productive mixing. Cleaning, adds and re-tests, and waiting for QC take another third, and the largest vessels lose the most to adds.
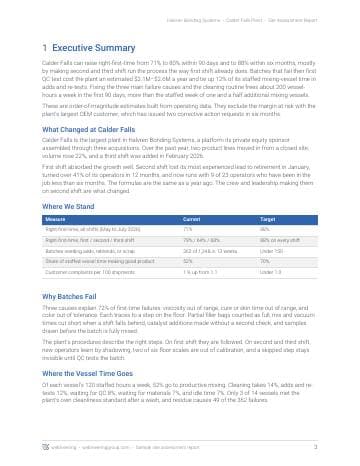
Three causes explain 72% of first-test failures. Fillers charged by bag count and scales out of calibration push viscosity out. Skipped catalyst checks and shortened mix and degas cycles move cure time. Dark-to-light changeovers bring color out.
Cleaning takes 14% of vessel time and leaves vessels short of the standard. Only 3 of 14 passed a post-wash audit, and residue caused 49 failed batches. Sequencing light to dark would avoid 41% of full washes.
Try the recovery
A simplified version of the batch-failure model in the report. Start from today's operation, then try the Phase 1 plan.
Batches that pass their first QC test with no addition.
Off target. 29 of every 100 batches fail their first test.
Based on 362 first-test failures in 1,248 batches over 13 weeks, 14 vessels staffed 120 hours a week, and about 7 vessel-hours per failed batch, including the re-test. Your plant's model is built from your own batch and QC records.
The plan
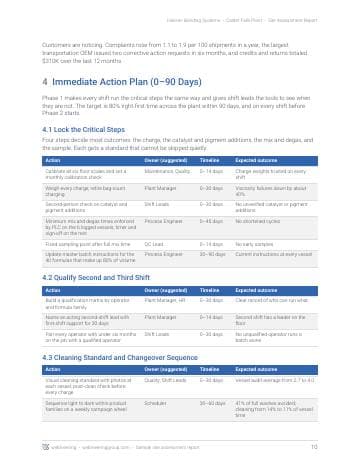
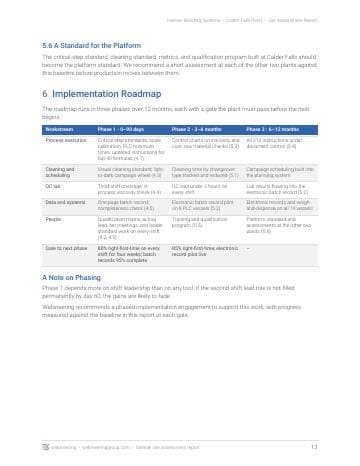
Each phase has a gate the plant must pass before the next one starts.
80% right-first-time on every shift for four weeks, and batch records 95% complete at release.
The deliverable
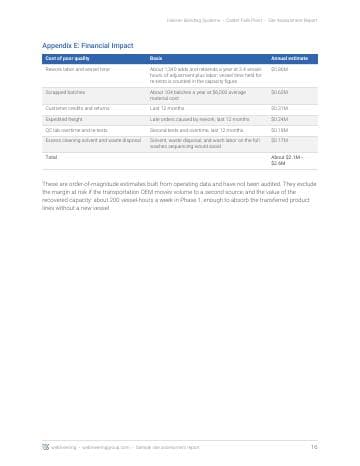
Every site assessment ends with a report like this one: the evidence, the failure and capacity models, a 90-day plan with owners, and a 12-month roadmap.
How a site assessment runs
These are the Study and Outline stages of our S.O.L.V.E. framework.
You send QC results, batch records, vessel or shift logs, and staffing records. We code every failure by cause and build an interview plan for each shift.
We follow batches from charge to release on every shift, audit cleaning and scales, sit in on tier meetings, and interview operators, leads, QC, and scheduling.
We quantify each loss, build the failure and vessel-time models, and deliver the report with a 90-day plan and owners.
Sample deliverable. A composite, with names and figures changed to protect client confidentiality.