What the system shows
The ERP, the buyers' screens, and the online store
- Inventory on record
- $21.4M
- Active SKUs
- 38,000
- Minimums raised by buyers
- 2,900 SKUs
Case study · Sample site assessment
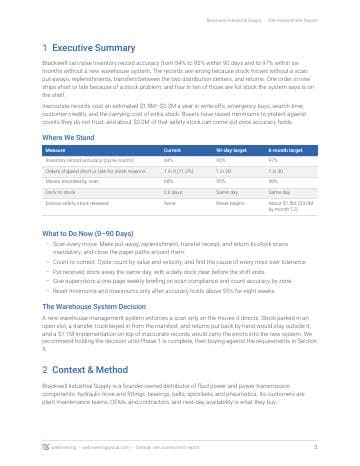
A founder-owned industrial distributor was weighing a $1.1M warehouse system. One order in nine shipped short or late, often for stock the system said was on the shelf. Our two-day site assessment traced the gap to moves made without a scan and showed how to fix the process first.
Sample deliverable. This case study and report are a composite. Company names, people, locations, and figures have been changed to protect client confidentiality.
| Category | Locations |
|---|---|
| Matched the system | 98 |
| System shows more than the shelf | 13 |
| More on the shelf than the system | 4 |
| A different item in the location | 5 |
The situation
Brackwell sells next-day availability to plant maintenance teams. Its online store shows live stock from the ERP, so every unit the system counts and the shelf lacks is a promise a customer sees and the warehouse cannot keep.
The ERP, the buyers' screens, and the online store
Two distribution centers, a hose shop, and two will-call counters
Why do customers get short shipments when our system says the stock is here?
Asked by the president, with two follow-on questions:
What we found
Four views of the same warehouse, from the short orders back to the moves behind them.
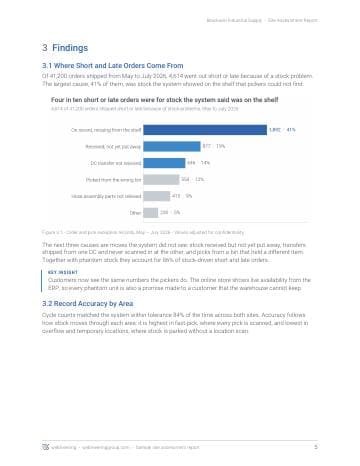
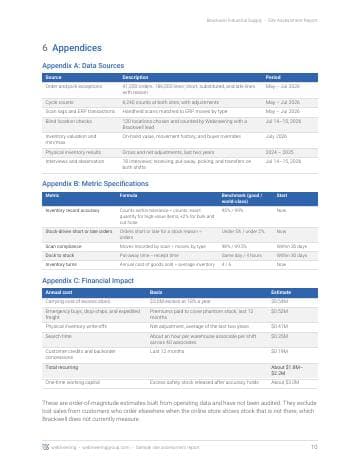
Of 41,200 orders in 13 weeks, 4,614 shipped short or late because of a stock problem. The largest cause was stock the system showed on the shelf that pickers could not find. Three more causes were moves the system never saw.
Counts matched the system 84% of the time. Accuracy follows how stock moves: highest in fast-pick, where every pick is scanned, and lowest in overflow and temporary locations, where stock is parked without a location scan.
Receipts and pick confirmations are scanned almost every time, because the system will not move forward without them. Put-aways, replenishments, transfers, and returns depend on habit, and under pressure the scan is the step that gets skipped.
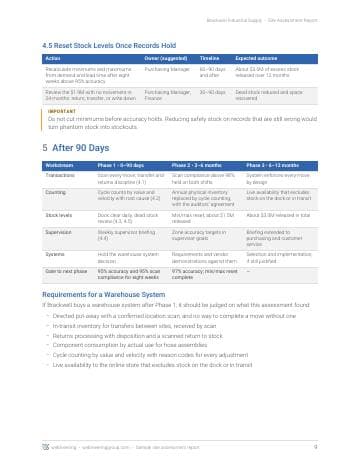
Buyers raised minimums on about 2,900 SKUs because they do not trust the counts, which carries $3.0M of extra stock. Another $1.9M has not moved in two years, and $1.3M is on record in locations nobody can find.
Try the recovery
A simplified version of the order-failure model in the report. Start from today's operation, then try the 90-day plan.
Cycle counts that match the system within tolerance.
Off target. One order in 9 ships short or late for a stock reason.
Based on 4,614 stock-driven short or late orders out of 41,200 over 13 weeks, traced to their causes, and 6,240 cycle counts. Release excess stock only after accuracy holds above 95% for eight weeks. Your model is built from your own order and count records.
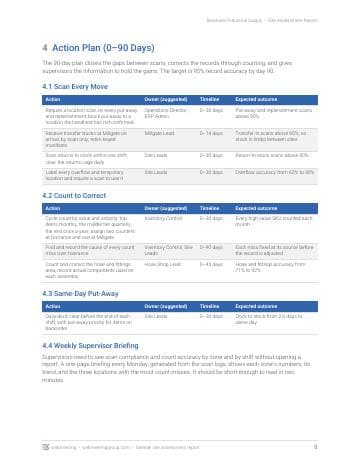
The plan
Each phase has a gate the warehouse must pass before the next one starts.
95% record accuracy and 95% scan compliance, held for eight weeks.
The deliverable
Our short format: one question, two days on site, and a focused report with the evidence, the cost, a 90-day plan with owners, and the requirements for any new system.
How a site assessment runs
These are the Study and Outline stages of our S.O.L.V.E. framework.
You send order exceptions, cycle counts, scan logs, and inventory valuation. We trace every short or late order back to the location and the move behind it.
One day at each site. We watch receiving, put-away, picking, and transfers on both shifts, check 120 locations blind, and interview the floor, purchasing, and customer service.
We quantify the cost, build the inventory model, and deliver the report with a 90-day plan, owners, and system requirements.
Sample deliverable. A composite, with names and figures changed to protect client confidentiality.