Semiconductor equipment
Gas-delivery manifolds, aluminum gas-panel bases, chamber cooling plates, cleanroom subassemblies
- Share of shipments
- 64%
- Engineering changes in 6 months
- 37
- Machining time vs estimate
- 1.12×
Case study · Sample site assessment
Data-center work grew from 12% to 36% of a precision hardware plant's shipments in just over a year. Every department reported record output while on-time delivery fell 28 points. Our site assessment traced the loss to one vacuum furnace and showed how to recover it without a capital request.
Sample deliverable. This case study and report are a composite. Company names, people, locations, and figures have been changed to protect client confidentiality.
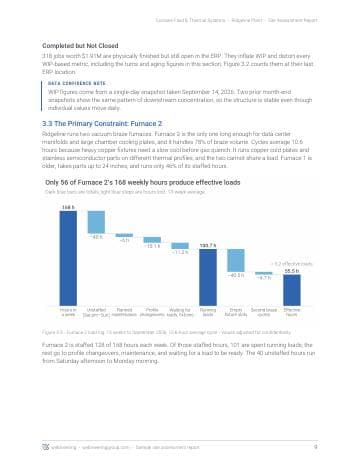
| Category | Hours |
|---|---|
| Effective | 56 |
| Empty fixture slots | 40 |
| Second braze cycle | 5 |
| Waiting for a load | 11 |
| Changeover or maintenance | 16 |
| Unstaffed | 40 |
The situation
Ridgeline built its business on semiconductor equipment parts. Then liquid-cooling hardware for AI data centers tripled its share of shipments in 13 months, and both product lines ran through the same few resources.
Gas-delivery manifolds, aluminum gas-panel bases, chamber cooling plates, cleanroom subassemblies
Copper cold plates, coolant manifolds, coolant distribution subassemblies
Why is delivery falling while every department reports record output?
Asked by the business unit's VP of Operations, with three follow-on questions:
What we found
Four views of the same plant, from the delivery numbers back to the cause.
Machining hours climbed to 112% of target while OTIF fell from 86% to 58%. Every report the plant ran measured activity, so the loss of flow at the constraint went unseen for most of a year.
WIP shows where work waits. A quarter of the plant's $14M sits in front of the braze cell, the largest share of any area and the clearest sign of the primary constraint. CMM inspection and outside plating queue up behind it.
Furnace 2 is the only furnace long enough for data-center parts. Only 56 of its 168 weekly hours produce effective loads. The rest go to unstaffed weekends, changeovers, waiting, and loads run partly empty to rush a late order.
New data-center parts run far over their machining estimates, and 61% of their engineering changes reach the floor after material is released. Parts arrive at the furnace late and in bursts, and every burst becomes another partial load.
Try the recovery
A simplified version of the capacity model in the report. Start from today's operation, then try the Phase 1 plan.
An effective load is one full furnace load that passes first time. A partial load counts by its fill.
Off track. The braze queue grows by 1.2 loads every week.
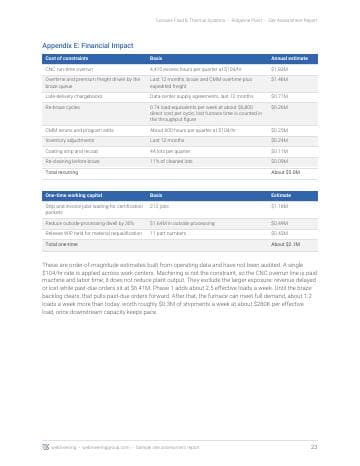
Assumes a 10.6-hour cycle, 6 hours of weekly maintenance, 2.4 hours per changeover, a current braze queue of about 14 effective loads, and about $280K of shipments per effective load. Added shipments count output up to demand of 6.4 loads; capacity above that clears the queue faster. Your plant's model is built from your own furnace data.
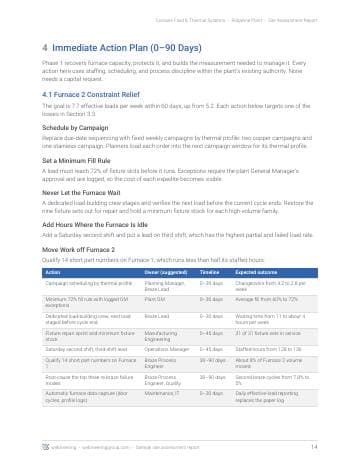
The plan
Each phase has a gate the plant must pass before the next one starts.
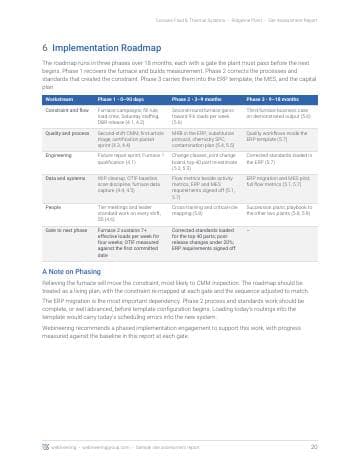
Furnace 2 sustains 7 or more effective loads a week for four weeks, and OTIF is measured against the first committed date.
The deliverable
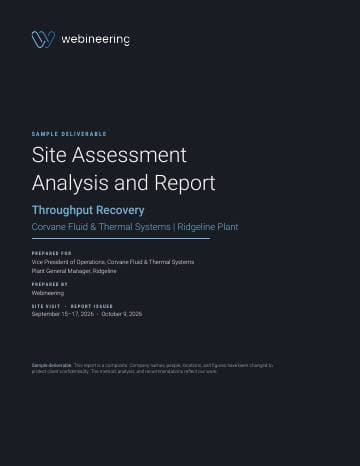
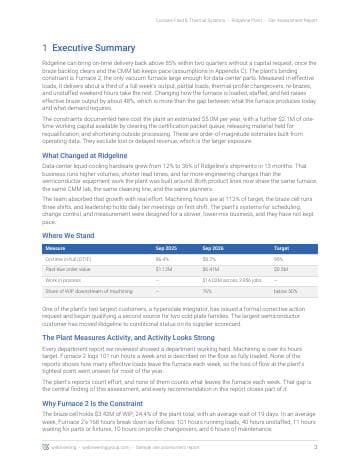
Every site assessment ends with a report like this one: the evidence, the constraint model, a 90-day plan with owners, and an 18-month roadmap.
How a site assessment runs
These are the Study and Outline stages of our S.O.L.V.E. framework.
You send a standard data request: daily metrics, a WIP snapshot, operation time records, and your constraint's logs. We build a first constraint hypothesis and an interview plan.
We walk material flow end to end on every shift, time the constraint, sit in on tier meetings, and interview 20 or more people, from leadership to operators.
We quantify each loss, build the capacity and financial models, and deliver the report with a 90-day plan and owners.
Next step
Sample deliverable. A composite, with names and figures changed to protect client confidentiality.