People
Hawthorne Effect in Audits: Watched Work Scores Higher

Anthony Occidentale and Alex LaDouceur
· 8 min read
An audit measures how the floor behaves while an auditor is standing on it. That number is real, and it runs higher than the number for an ordinary night shift. Plants that rely on scheduled, visible audits are grading their best behavior and filing it as their normal behavior.
A Toronto hospital caught its own audits inflating the numbers
Hospitals audit hand hygiene the way most plants audit the floor. A trained observer stands in a unit, watches staff, and records whether each person cleaned their hands at the right moment.
Jocelyn Srigley and colleagues at University Health Network in Toronto had a way to test that method. Their hospital ran a real-time location system that logged every use of the hallway hand-rub dispensers and also tracked the auditors' badges.
When an auditor was in view, dispensers recorded 3.75 hand hygiene events per hour. Dispensers on the same unit that the auditor could not see recorded 1.48 at the same time. The same visible dispensers had logged 1.07 per hour in the week before the auditor arrived.
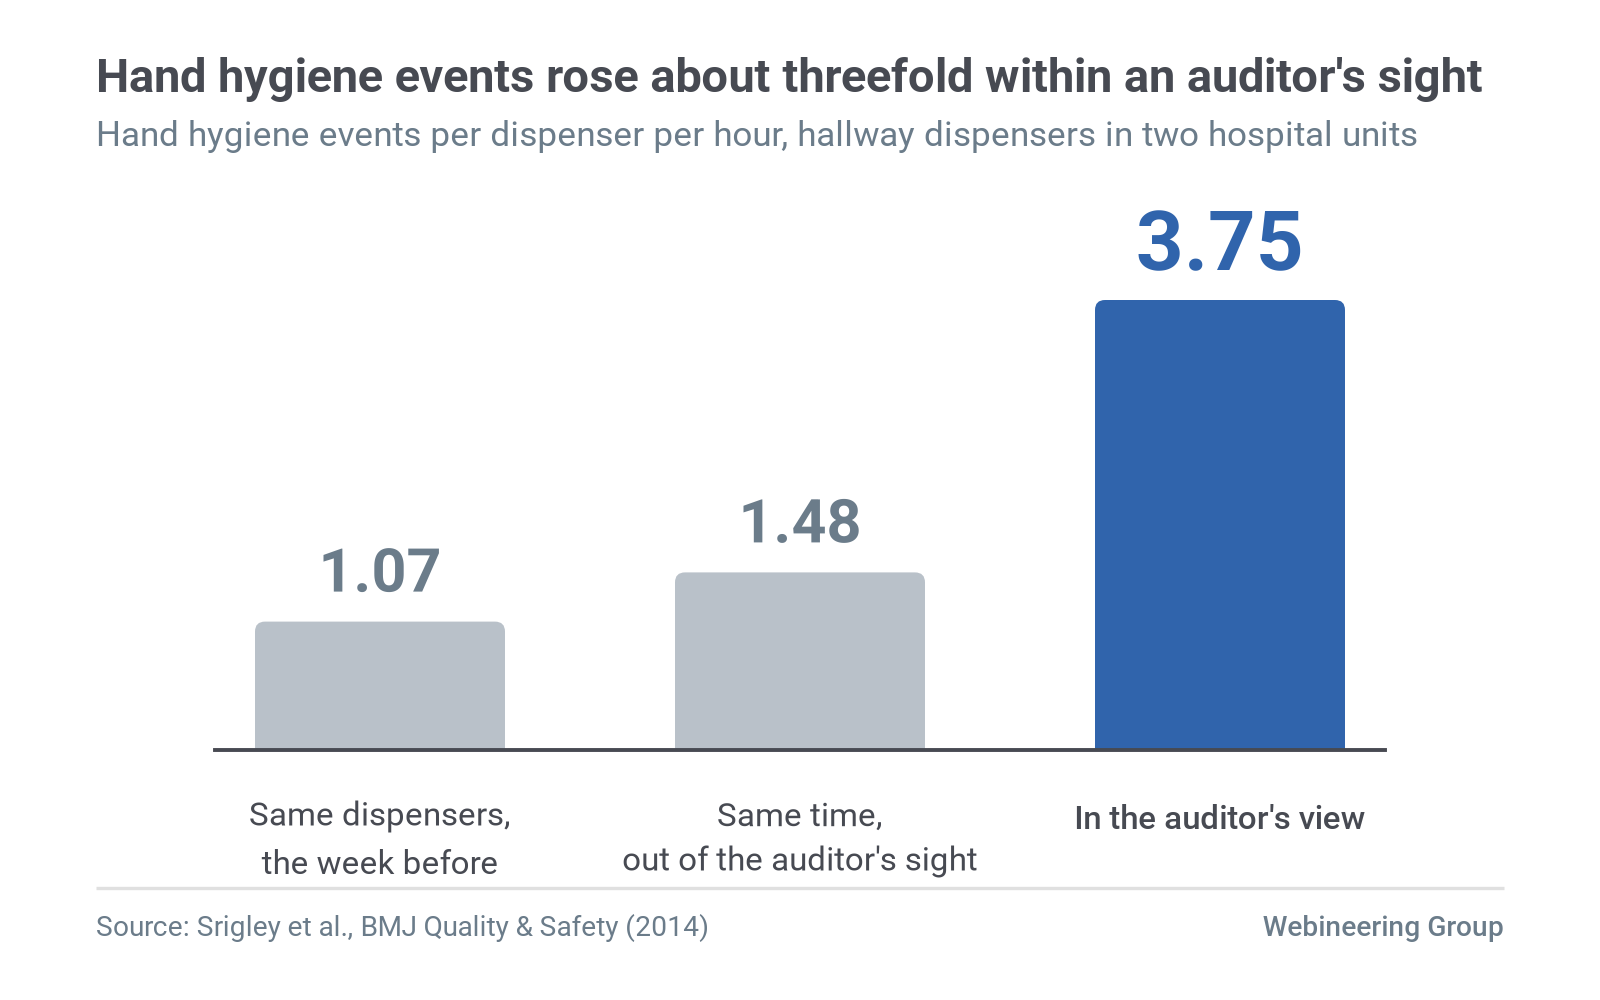
The team published the result in BMJ Quality & Safety in 2014. They called it "consistent with the existence of a Hawthorne effect localised to areas where the auditor is visible." The effect followed the auditor's line of sight.
That is the whole problem in one hallway. The audit gave an accurate count of what happened in front of the auditor, and it said very little about the hallway around the corner. The authors wrote that the result "calls into question the accuracy of publicly reported hospital hand hygiene compliance rates," which came from the same kind of visible audit.
Scheduled audits are the standard advice, and they capture the best hour of the week
Most guidance on floor audits follows one pattern. Pick a checklist, set a calendar, score each area, post the trend, and escalate the misses. The top-ranking pages on 5S audits, layered process audits and gemba walk audits, most of them from software vendors, follow it closely.
That advice gets frequency and coverage right. The gemba walk pages go a step further and warn that a walk run like an inspection makes people hide problems. One guide shows how to turn daily walks into "structured audits" with predefined criteria and follow-up actions.
None of the leading pages measure what the auditor's presence does to the score itself. They also stop short of the obvious next step: sampling the shifts nobody announced.
Regulatory inspection data show why that question matters. Matthew Makofske, an economist at Colgate University, studied restaurant health inspections at sites where several kitchens share one location, such as a casino resort. The first kitchen inspected on a visit gets no warning, while the rest can see the inspector coming.
Makofske published his Southern Nevada Health District data in the Journal of Economic Behavior & Organization in 2021. Kitchens inspected first were assessed 21% more demerits and cited for 31% more critical violations than the same kitchens on days they were inspected later in a visit.
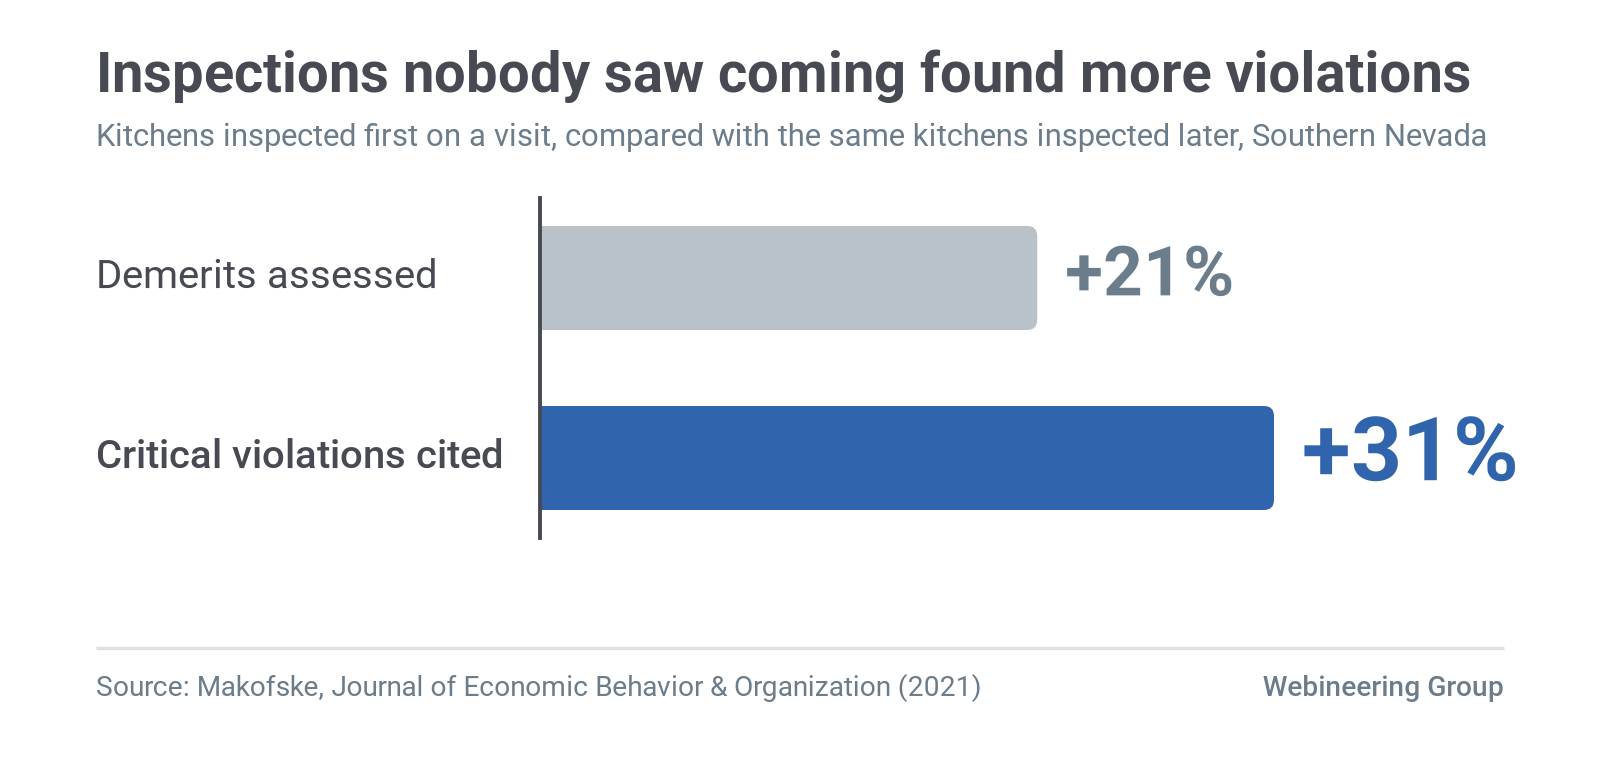
In an earlier Los Angeles County study (Makofske, Economics Letters, 2019), inspections that could not be anticipated found 7.75% more violations and 16.3% more major critical violations. A few minutes of warning was enough to move the score.
A plant audit on a posted schedule gives far more warning than that. A 5S audit every Thursday at 10 a.m. gives the area a full shift to prepare.
Makofske also found that the anticipation effect concentrated in violations staff can correct quickly before an inspection begins. On a plant floor, housekeeping, labels, personal protective equipment and board updates all fall in that group. Machine condition and training records take longer to fix, so a warning moves them less.
Hawthorne Works gave the effect its name, and its own data are weaker than the legend
The term comes from studies at Western Electric's Hawthorne Works near Chicago between 1924 and 1932. The best-known account is Fritz Roethlisberger and William Dickson's 1939 book, Management and the Worker, published by Harvard University Press.
The popular story says output rose whenever researchers changed the lighting, up or down, because workers knew they were being studied. The original data from the illumination tests, which ran from 1924 to 1927, were long thought lost.
Economists Steven Levitt and John List found them and reanalyzed them in American Economic Journal: Applied Economics in 2011. Their verdict: "Existing descriptions of supposedly remarkable data patterns prove to be entirely fictional." They did report "more subtle manifestations of possible Hawthorne effects."
A wider review lands in a similar place. Jim McCambridge, John Witton and Diana Elbourne reviewed 19 studies in the Journal of Clinical Epidemiology in 2014. They concluded that research participation effects "do exist, although little can be securely known about the conditions under which they operate, their mechanisms of effects, or their magnitudes."
So the factory study that named the effect is a poor foundation for it. The case for observer effects in audits rests on newer measurement, and that measurement is fairly clear.
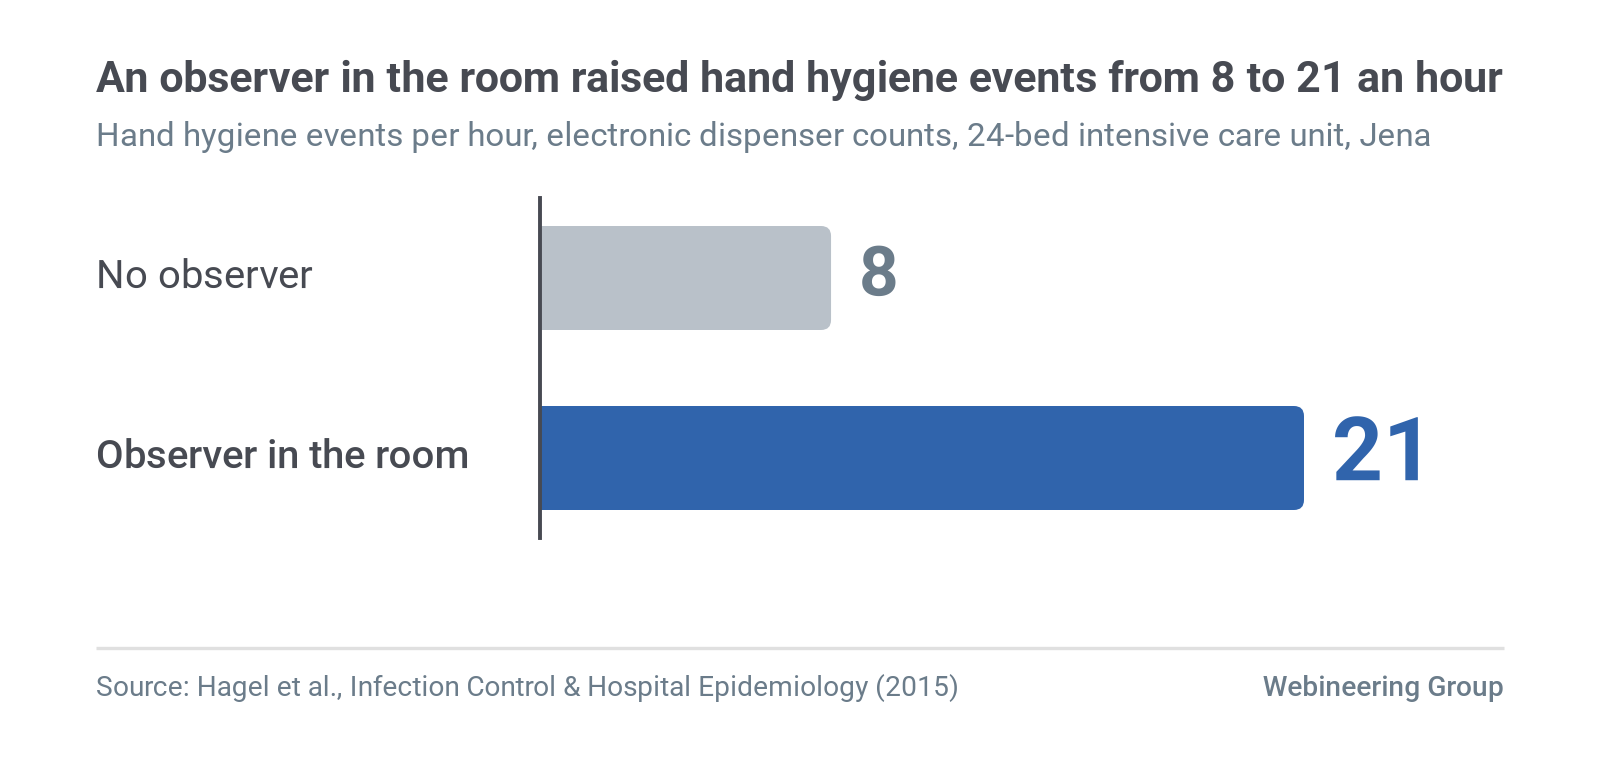
In 2015, Stefan Hagel and colleagues at Jena University Hospital in Germany compared 48 two-hour direct observations in a 24-bed intensive care unit with electronic dispenser counts. Hand hygiene events averaged 21 per hour with an observer in the room and 8 per hour without one.
That is a 2.6-fold rise, which Hagel called "a nearly three-fold increase" in an interview with Infectious Disease News. It came from a different country and a different kind of unit from Srigley's study.
Three forces push a visible audit score above the real floor
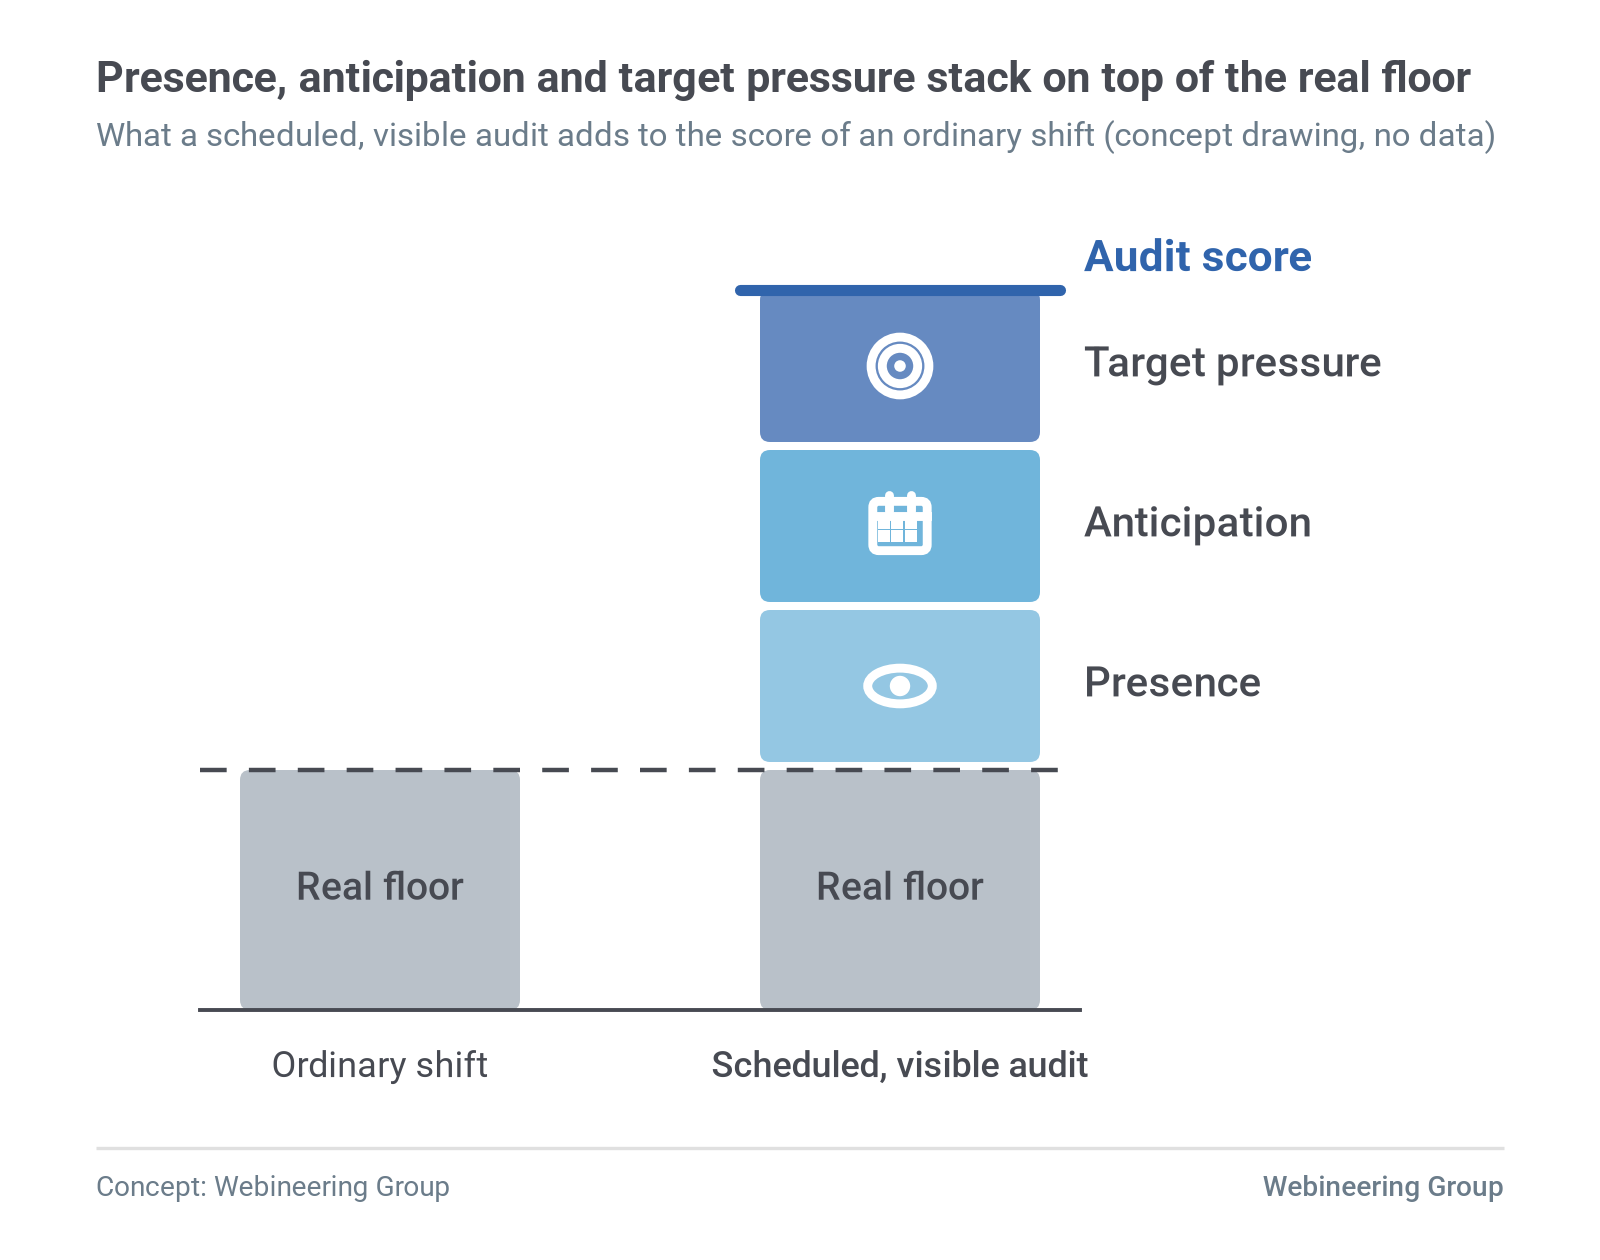
Presence, anticipation and target pressure each add to the score, and they stack.
| Force | What drives it | Evidence | Plant example |
|---|---|---|---|
| Presence | People do the step when someone is watching | Srigley 2014: visible dispensers logged 3.75 events per hour, unseen dispensers 1.48 | Operators put on safety glasses as the walk turns into their aisle |
| Anticipation | Predictable timing lets the area prepare | Makofske 2021: first-inspected kitchens were assessed 21% more demerits | The 5S zone gets swept before the Thursday 10 a.m. audit |
| Target pressure | The score affects someone's review or bonus | Campbell 1976: indicators used for decisions face "corruption pressures" | Audit prep becomes a standing task on the shift before each audit |
Presence can be local and fast. Srigley's data show it limited to the hallway the auditor could see.
Anticipation scales with warning. Makofske's kitchens moved their scores with only minutes of notice, and a posted plant schedule gives days.
Target pressure has the oldest name. Social scientist Donald Campbell described it in a 1976 Dartmouth College occasional paper, reprinted in Evaluation and Program Planning in 1979. He wrote that an indicator used heavily for decisions becomes "more apt" to "distort and corrupt the social processes it is intended to monitor."
Economists know a close cousin from Charles Goodhart's 1975 paper on UK monetary policy: "Any observed statistical regularity will tend to collapse once pressure is placed upon it for control purposes." Put an audit score on a plant manager's scorecard and all three forces get stronger. The score keeps climbing, and what it tracks shifts from how the area runs to how well the area prepares.
Gemba walks and safety walks carry the same bias. A leader in a high-visibility vest is easy to spot from 50 meters away, and the parts of the floor on the walk route get the most attention.
Less reactive measurement follows four design rules
Keep the audits, and change what they look at and when they happen.
| Rule | What to do | What it measures | Force it weakens |
|---|---|---|---|
| 1. Randomize timing, route and day | Draw audit slots from a random schedule across every shift, nights and weekends included | Conditions at an unpredictable moment | Anticipation |
| 2. Measure what the shift leaves behind | Check logs, checksheets, red tags, scrap tickets, torque records and board entries | Behavior during hours nobody watched | Presence |
| 3. Rotate and calibrate auditors | Keep the same person off the same area twice in a row, and calibrate auditors each quarter | Consistency across auditors | Anticipation and auditor drift |
| 4. Audit the routine across unchecked shifts | Pull a random week of records and test them against the standard | Whether the system runs without an audience | Target pressure |
Rule 1 borrows from work sampling, which L.H.C. Tippett introduced as a "snap-reading" method of random-moment observations in the Journal of the Textile Institute in 1935. Nobody can prepare for a moment they can't predict.
Rule 2 is the plant version of Srigley's dispenser counts. The counter kept recording after the auditor left, and that record told the real story. Check that time stamps match when the work happened, that readings vary the way real readings vary, and that the last 10 entries look like the first 10.
Rule 3 builds on what many suppliers already run. The Automotive Industry Action Group's CQI-8 Layered Process Audit Guideline, second edition (2014), spreads audits across management layers at different frequencies. Rotation adds unpredictability to that structure.
Rule 4 changes the question an audit answers. A leader standard work card that is complete on audit days and blank on the others tells you more than any single walk.
Your own records can measure the gap before you redesign anything
You can run a small version of the Srigley comparison with data you already have. Pick one outcome the shift records anyway, such as first-pass yield, scrap per hour or downtime minutes, and split the last 90 days into audit days and non-audit days.
If the numbers differ, you have measured your own observer effect. If they match, your scheduled audits may be reading the floor accurately, and your effort can go elsewhere.
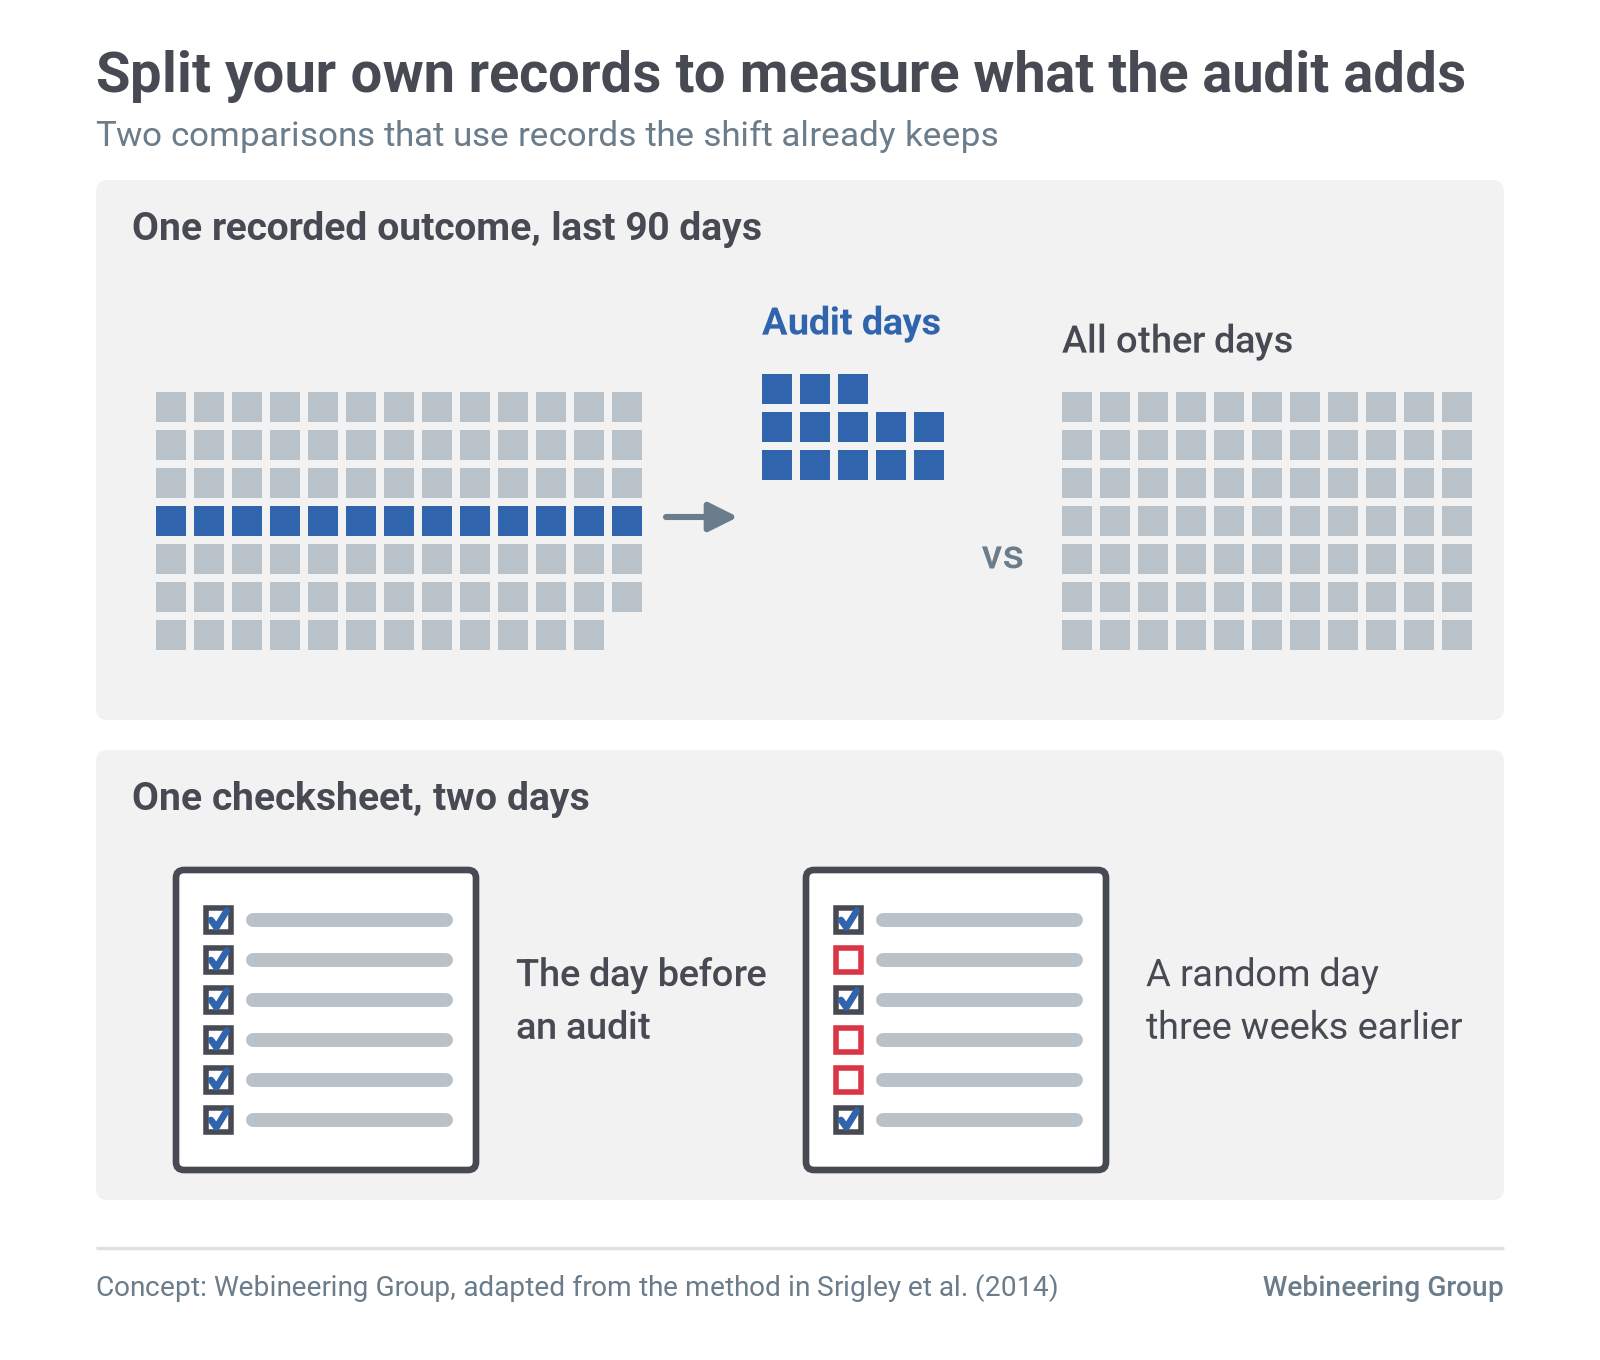
Run the same comparison on the artifacts. Compare checksheet completeness on the day before an audit with a random day three weeks earlier. A large difference is a direct estimate of how much the audit score flatters the floor.
This test takes an afternoon with a spreadsheet. It also gives you a baseline, so you can tell whether the redesigned audit closes the gap.
Visible audits still earn their place in three situations
Coaching is the first. Srigley noted that auditors on the floor still create chances for in-the-moment teaching. A leader who walks the line to teach and listen is doing useful work, as long as the plant stops treating that walk as a measurement.
Machine-recorded data is the second. If a torque tool logs every fastening to a server, or an interlock stops the machine when the guard is open, the auditor's presence doesn't move the data. Reactivity matters where people control both the behavior and the record.
Customer-required formats are the third. Automotive suppliers certified to IATF 16949, the International Automotive Task Force quality management standard, often run layered process audits on a defined plan. That requirement comes from customers, such as clause 9.2.2.3 of General Motors' 2025 customer-specific requirements. Keep the required audits as specified, and add an unannounced sample alongside them.
Monday
- Pull 90 days of one floor outcome and split it into audit days and non-audit days.
- Replace one fixed audit slot with a randomly drawn time, including at least one night or weekend shift.
- Add two artifact checks to your audit sheet: time stamps on one log and the oldest open item on one board.
- Rotate auditors so nobody audits the same area twice in a row.
- Remove audit scores from any scorecard where the person being scored also controls the audit timing.
Check the measurement first
If your audit scores look better than your scrap, downtime or safety numbers, check the measurement first. Webineering's fixed-fee site assessment reviews your floor processes, records and reports, including how your audits are scheduled and scored. You get a written comparison of what your audits report and what your records show on ordinary shifts.
Site assessment
Want to see where your own line stands?
An evidence-backed report on where real value lies, from the people who stay through implementation.
About the authors
Alex LaDouceur
Founder
Alex has led Webineering since it started in 2022. At DuPont's Circleville plant he held senior engineering and engineering management roles on the $250 million Kapton and Pyralux expansion, a continuous web line taken from design to qualified production. At Schlumberger he was responsible for assembly, test and refurbishment across deepwater completions product lines.