Lean
5S Audit Scoring: Why Scores Rise While the Floor Gets Worse

Anthony Occidentale and Alex LaDouceur
· 3 min read
5S audit scores often climb for reasons unrelated to the floor. Vague score levels drift upward, areas get cleaned just before the audit, and checklists score sort, set in order and shine while standardize and sustain go unmeasured. Write anchors for every level, score the last two steps on evidence, calibrate auditors, and track how long conditions hold.
A forum post describes the pre-audit tidy
In a February 2004 thread on the Elsmar Cove quality forum, a poster described a plant that audited 5S "once a month, on the third Wednesday." A user named WALLACE replied: "If the 5S audit is regularly scheduled, wouldn't this be just an opportunity for a quick tidy up before the scheduled audit takes place to save face at each audited location? I've seen this happen a lot at my location."
The original poster did not dispute the point. The plant expected people to keep stations neater over time "to avoid the sudden panic cleaning." This is one forum thread, and it matches a pattern most plant managers will recognize.
Common checklists score what is easy to see
Top-ranking 5S audit pages from SafetyCulture, Tervene and Intelycx offer question lists for each S, scored yes or no or from 1 to 5. Most questions ask whether something is clean, labeled or in place.
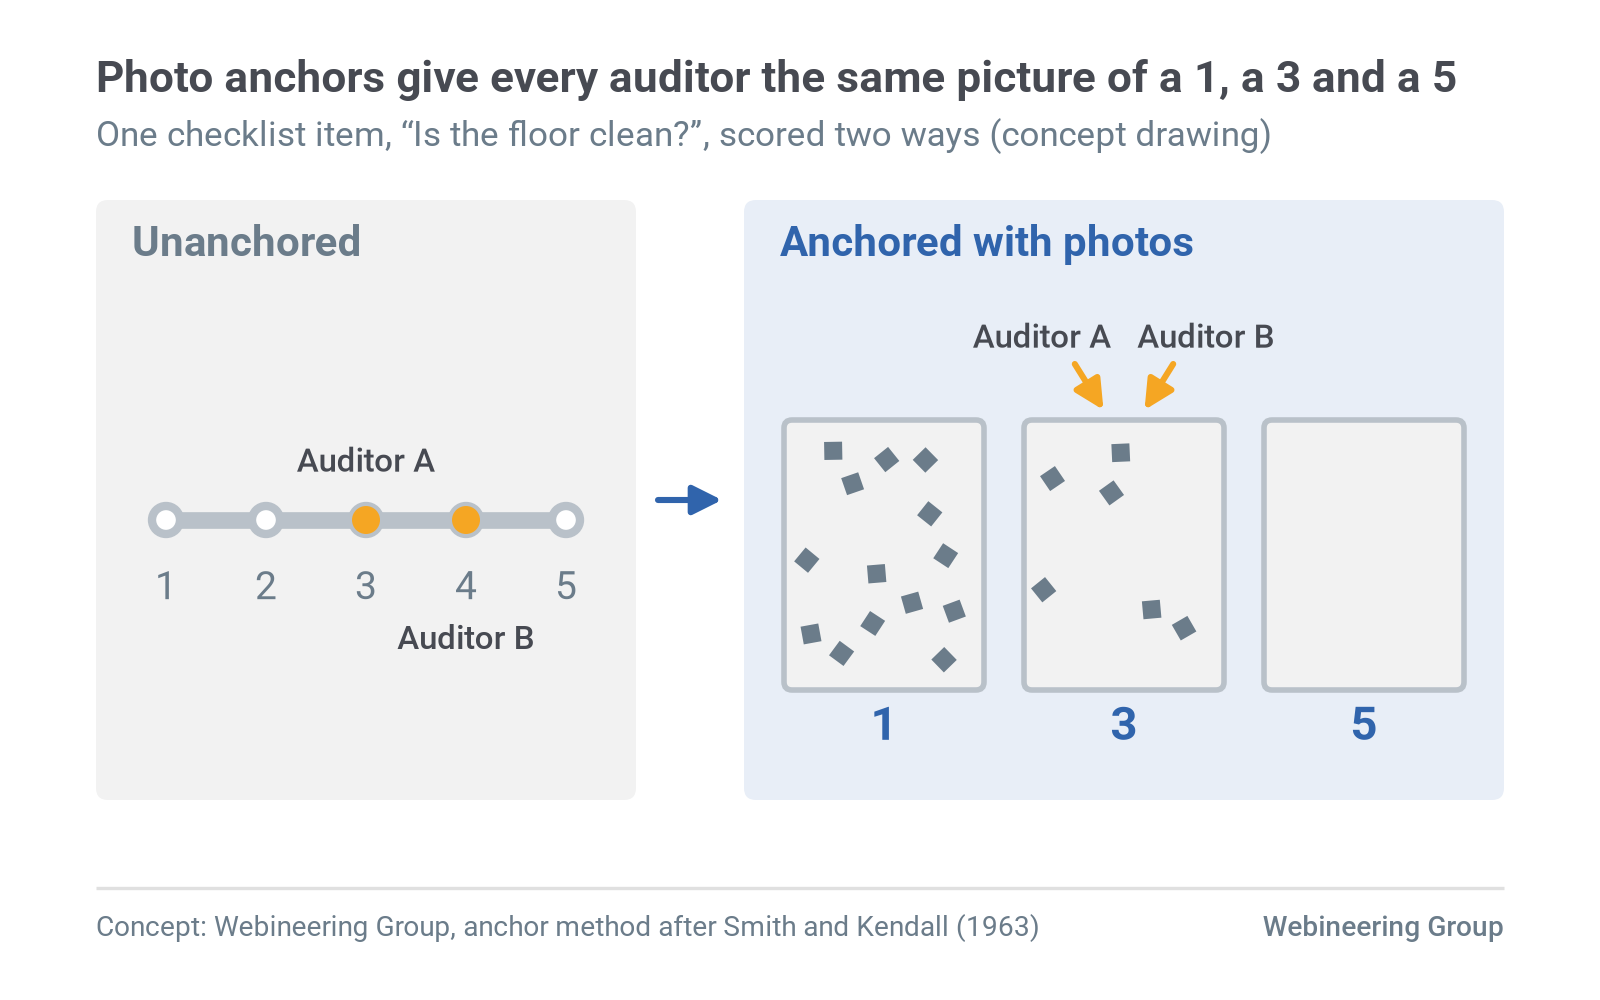
That works for a first audit. Over months it breaks, because "Is the floor clean?" scores a 4 for one auditor and a 3 for the next, and nothing on the sheet says who is right.
Vague levels, predictable timing and missing evidence inflate scores
Three causes stack up. Unanchored levels let each auditor's idea of "good" drift. Scheduled audits reward a cleanup the day before, and standardize and sustain get scored on whether a sign exists.
Patricia Smith and Lorne Kendall addressed the first cause in 1963 in the Journal of Applied Psychology. Their method collects concrete behavior examples, has a second group sort each one back to its performance dimension, and keeps only examples with high agreement as scale anchors.
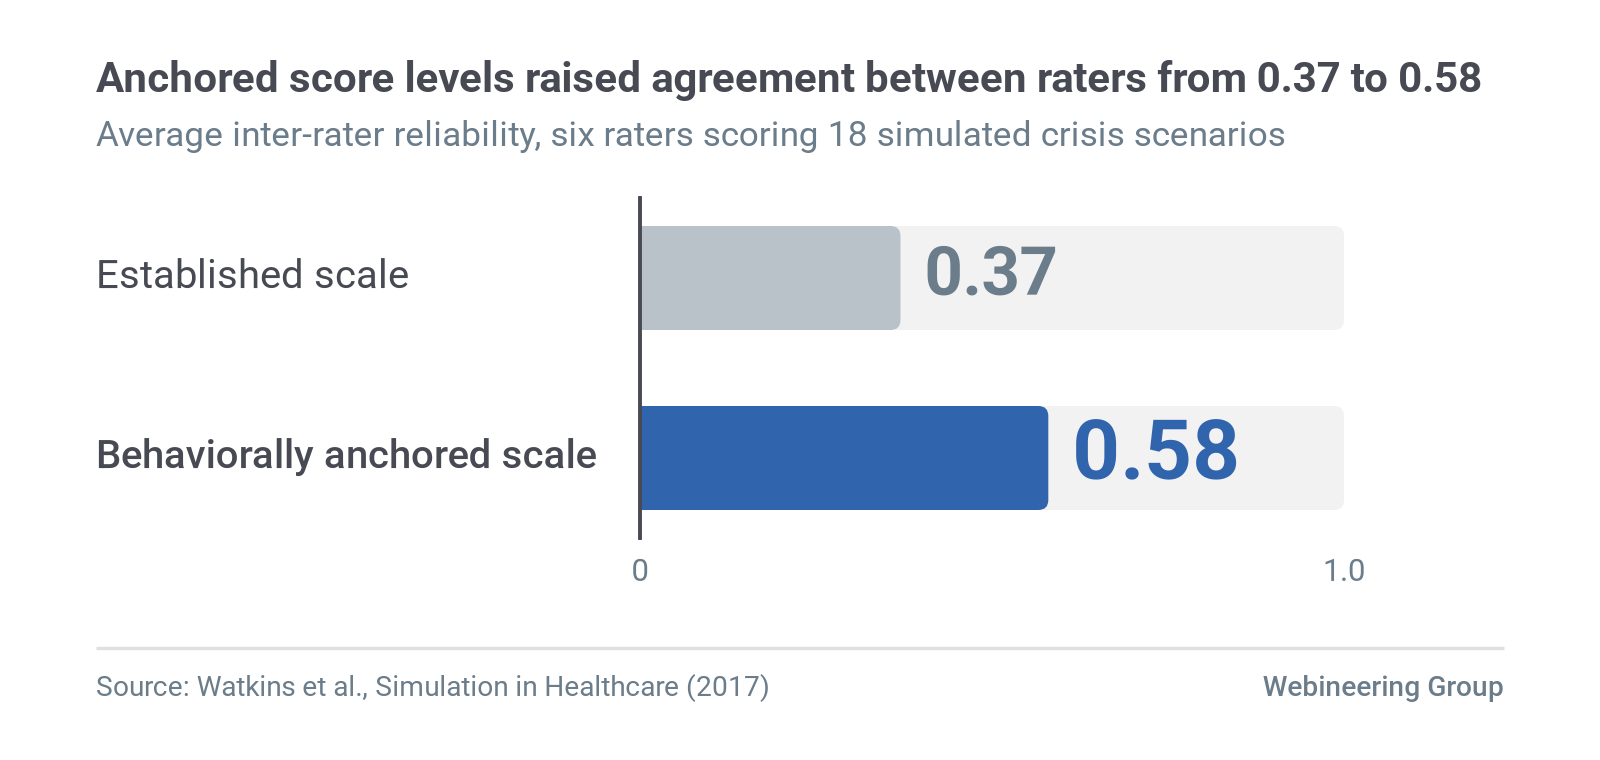
Later work supports the idea with limits. Scott Watkins and colleagues reported in Simulation in Healthcare in 2017 that a behaviorally anchored scale reached average inter-rater reliability of 0.58, against 0.37 for an established nontechnical skills scale. The raters scored anesthesia providers in simulated crises, so treat the result as direction for a plant.
Sustain is where programs fade, and the survey evidence is thinner than it looks. Cristina Jaca and colleagues surveyed large manufacturers in Spain's Basque Country and Navarra and in Mexico's Toluca-Lerma region in 2009, publishing in Intangible Capital in 2011.
They report that 41% of responding organizations in the Basque Country and Navarra, and 32% in Toluca-Lerma, had abandoned their continuous improvement systems. In the Basque Country and Navarra, the text says 5S had the second-highest abandonment rate after Six Sigma; the rate itself appears only in a chart.
Three limits apply. The sample was firms with more than 50 employees that had joined local quality programs. The discussion also cites a 51% Toluca-Lerma figure that counts abandoned techniques and methods, a separate measure from the share of firms, and the paper's response totals differ between sections.
Anchor, evidence, calibrate and time
| Fix | How to do it |
|---|---|
| Anchor every level | For each item, write what a 1, 3 and 5 look like, with a photo of each from your own floor |
| Score standardize on evidence | Check the standard is posted at the point of use, is the current revision, and matches what the operator does |
| Score sustain on time | Score how many unannounced spot checks since the last audit found the area at standard |
| Calibrate auditors | Each month, two auditors score one area separately and discuss any item more than one point apart |
| Track holding time | Record the days each area held standard between audits, and trend it next to the score |
Two conditions call for a lighter approach
Areas in their first 5S pass. During the initial sort, a simple checklist is enough. Add anchors once the area has a standard to hold.
Very small shops. Where one person audits a handful of stations, calibration has no partner. Use dated photos from each audit as the reference.
Start on Monday with these steps
- Pick the three checklist items with the widest score spread last quarter.
- Photograph a 1, a 3 and a 5 for each item.
- Rewrite standardize and sustain questions to require evidence.
- Schedule one unannounced spot check per area this month.
- Pair two auditors on one area and compare scores.
A site assessment checks what your scores measure
Webineering's site assessment reviews floor processes, records and reports, which can include your 5S audit records. You receive a written findings report that compares what we observed with what the records show and recommends specific fixes. Get in touch to schedule one.
Site assessment
Want to see where your own line stands?
An evidence-backed report on where real value lies, from the people who stay through implementation.
About the authors
Alex LaDouceur
Founder
Alex has led Webineering since it started in 2022. At DuPont's Circleville plant he held senior engineering and engineering management roles on the $250 million Kapton and Pyralux expansion, a continuous web line taken from design to qualified production. At Schlumberger he was responsible for assembly, test and refurbishment across deepwater completions product lines.