Operations
Turn Your Value Stream Map Into Projects the Plant Will Fund and Finish


Anthony Occidentale and Alex LaDouceur
· 9 min read
A value stream map is the cheap part, and it pays off only when each opportunity becomes a project with a score, an owner, a budget and time on someone's calendar. A value stream mapping action plan scores three things per opportunity: days of lead time removed, cost band and the roles the change touches. The third is the one top-ranking guides skip, and it tracks the change acceptance that kaizen research links to results that last.
Fourteen bursts on the wall and two finished
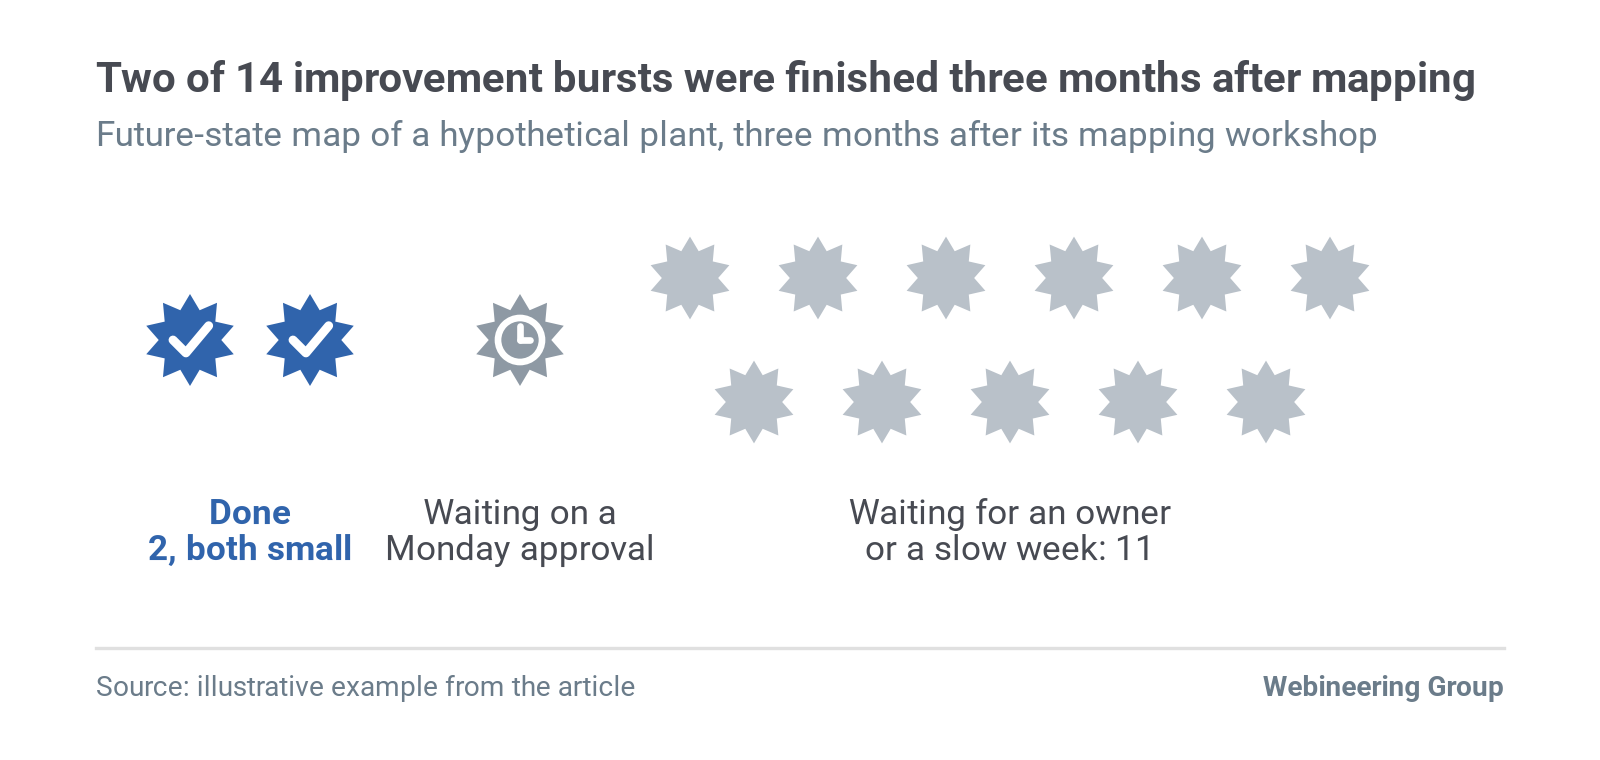
Picture a hypothetical plant three months after its mapping workshop. The future-state map hangs in the conference room with 14 improvement bursts.
Two are done, both small. One waits for a Monday approval meeting, and the rest wait for an owner or a slow week.
That Monday wait comes from a real map. Dan Markovitz, writing on his consulting blog on October 28, 2020, described a camping accessories maker that received Amazon's weekly order electronically every Monday. The build plan then sat because the director of operations was in a regular three-hour Monday morning meeting.
The fix was a calendar change. He pushed his meeting back one hour so he could approve the build plan as soon as it was ready, and the company moved to small batches every weekday. Markovitz reports that the company now ships Amazon's order the same day or, at worst, the next.
A map tied to one named change pays off. In a 2023 success story from the National Institute of Standards and Technology (NIST) Manufacturing Extension Partnership, Sonitek, a Connecticut maker of heat staking machines, ran a current-state mapping exercise with CONNSTEP. The team then reworked kit preparation for its Spectrum Series heat staking machines.
Before the change, typical lead time for one assembly line of custom machines was 18 to 20 weeks. Afterward the team completed two lines in 14 weeks, according to the NIST case page, which gives no project dates.
Both cases share one trait: somebody owned a named change and had the authority and the hours to make it.
Owners and dates leave the hard part unscored
The standard advice is to build an action plan with owners and dates. Creately's value stream mapping guide, the Access Group's mapping booklet and the Six Sigma Study Guide each end on a version of it.
The advice is sound as far as it goes, and it breaks in four places.
- One idea per burst. Nobody writes a second option, so the first idea gets judged alone and the cheaper fix never reaches the table.
- Guessed cost and unscored change effort. A schedule change that touches five roles looks as easy on the plan as a fixture that touches one.
- No time to act. Dan Markovitz wrote in 2008 that the people who mapped the new direction "don't have the time to actually make the changes," so the 30-, 60- and 90-day milestones go unmet.
- Map as decoration. Severino Abad, a lean coach at Instituto Lean Management in Barcelona, wrote in Planet Lean in May 2019 that he sees maps used "more as 'decoration'". In his view, "a good value stream map, however, is alive."
Abad names one more risk. When mapping gets cut off from problem solving, the teams who found the opportunities get frustrated. That frustration is a change-acceptance problem, and it's the one the scoring below is built to catch.
Acceptance of the change keeps the gain
Lead time on a map is mostly queue time, so the plan should rank each change by the queue days it removes and by how many people must work differently to remove them. The second number bears on whether the gain survives.
Wiljeana Glover, Jennifer Farris, Eileen Van Aken and Toni Doolen studied 65 kaizen events in eight manufacturing organizations for the International Journal of Production Economics in August 2011. A kaizen event is a team that spends two to five days redesigning one work area. In Glover's 2010 Virginia Tech dissertation on the same study, performance review and accepting changes were significant direct or indirect predictors of several outcomes for work area attitude and commitment. Those outcomes were measured nine to 18 months after the events.
That result points at people, and a hospital study shows the same pattern in a different setting.
Erik Haapatalo and colleagues at the University of Helsinki followed 26 kaizen events held from 2017 to 2020 in Finland's largest academic hospital system, reported in BMJ Open in 2023. Of 21 units interviewed in 2021, 13 (62%) sustained long-term results, three (14%) couldn't sustain their gains and five (24%) struggled to improve at all.
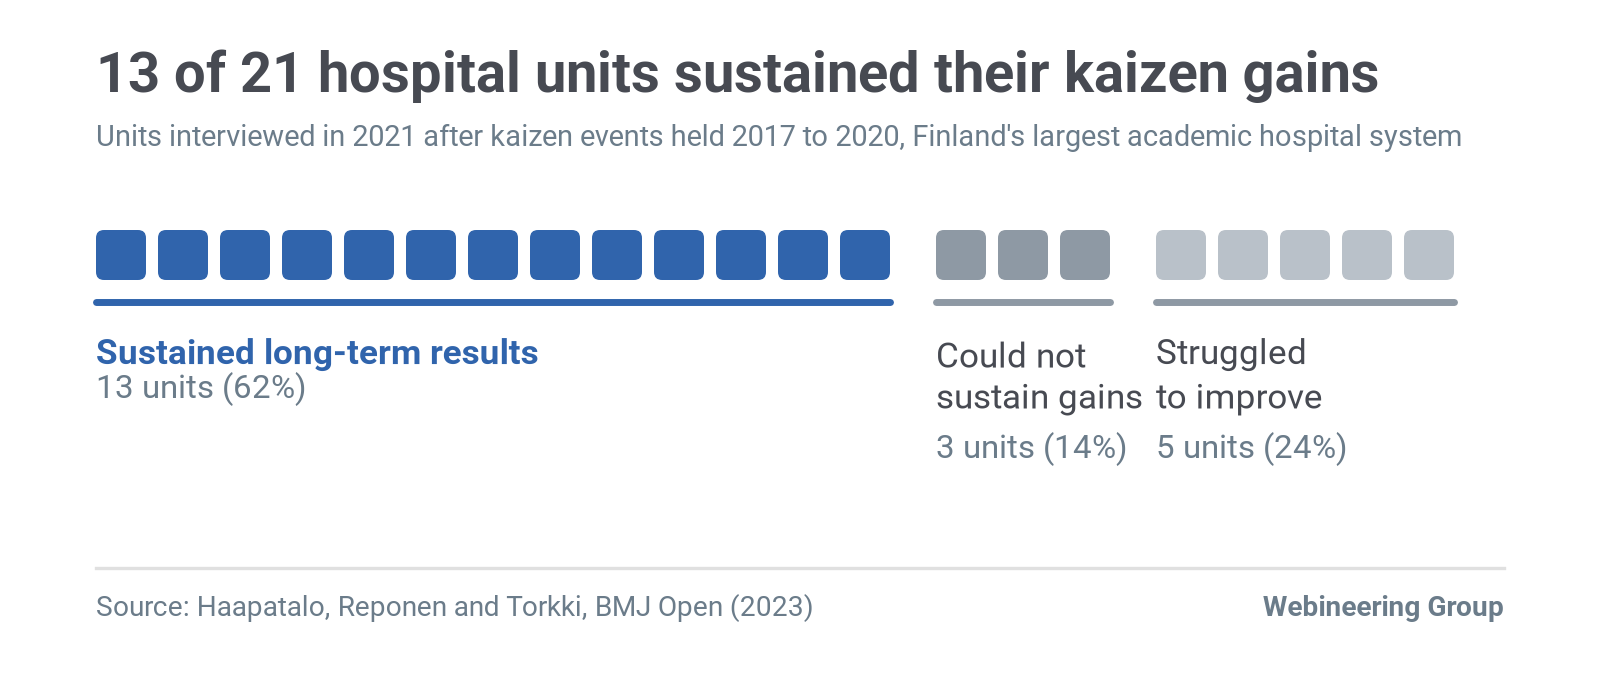
Success in preparation and follow-up went with sustained results. Lack of time and high workload went with decline. A hospital ward runs differently from a press line, so read this as a pattern to check in your own plant.
Follow-up matters in factories too. Toni Doolen and colleagues, in a 2008 field study of two kaizen events in the International Journal of Productivity and Performance Management, found that event success varied even within one organization. They told leaders to watch follow-up closely to keep results.
A value stream mapping action plan in seven steps
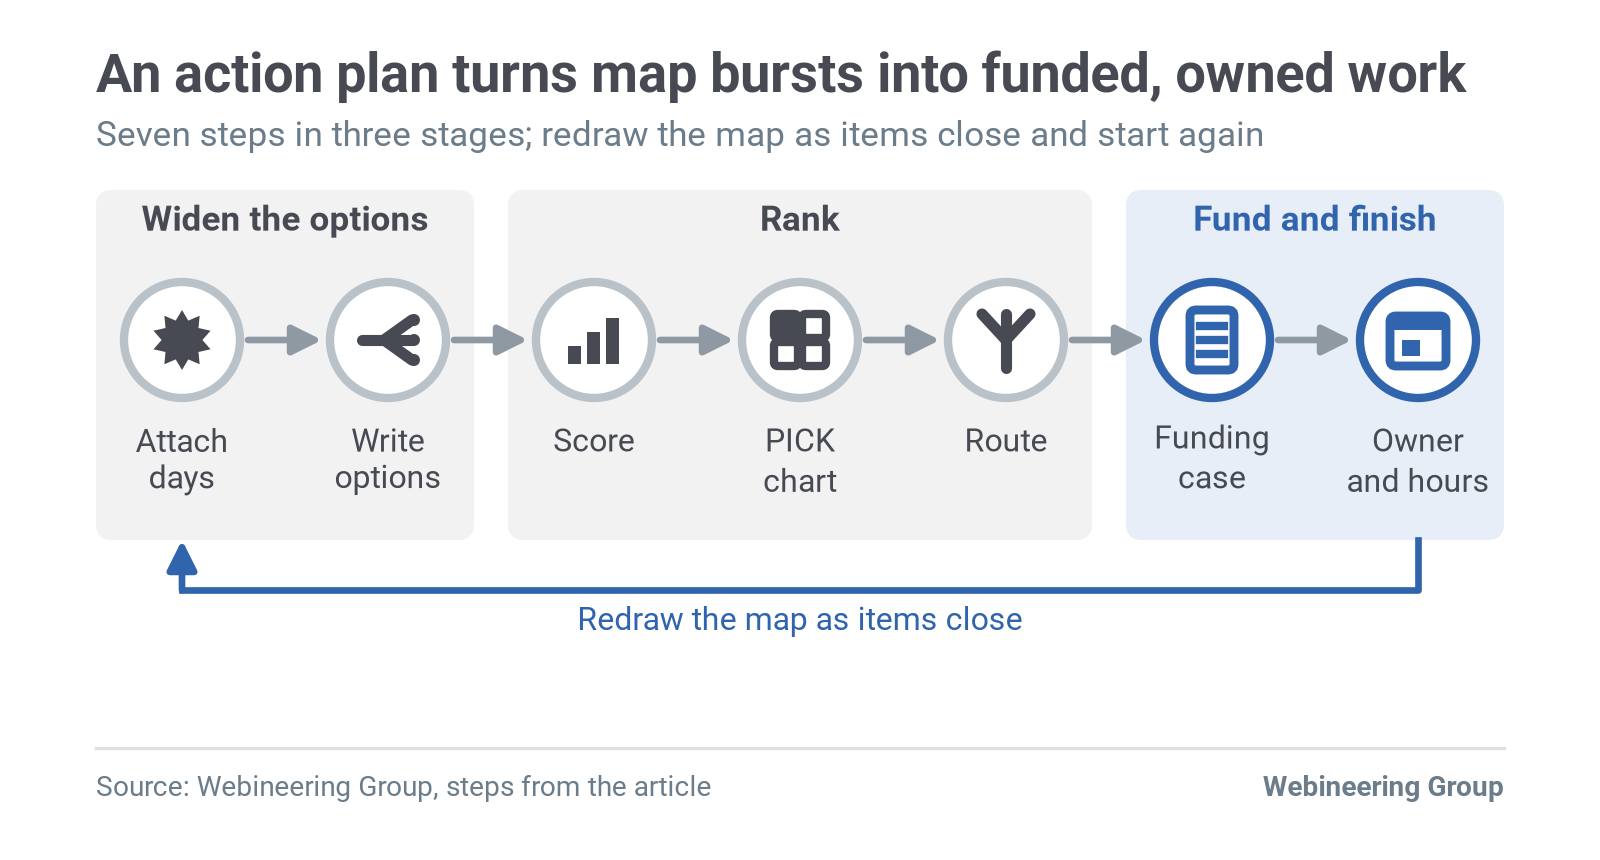
The seven steps below turn bursts into funded, owned work. Steps one and two widen the options. Steps three to five rank them, and steps six and seven get them paid for and finished.
- Number each improvement burst and attach its days. Read the queue days off the timeline under each burst. A burst with no days attached can't compete with one that has them.
- Write two or three options per large wait, in a fixed order. Ask what you can eliminate, then combine, rearrange and simplify, and only then automate. Art Smalley, president of Art of Lean, Inc., teaches the first four in a 2020 Lean Enterprise Institute video series. He says he learned the method "over 30 years ago" at Toyota, in a kaizen course with roots in the Job Methods course of Training Within Industry. We add automate as the last lens because software and equipment are the slowest and costliest way to remove a wait.
- Score each option on days removed, cost band and change effort. Cost band runs 1 for a procedure, layout or schedule change, 2 for minor tooling or configuration, and 3 for capital or information technology (IT) work.
- Place the options on a PICK chart. PICK stands for possible, implement, challenge and kill.
- Route each option. Sort it into a just-do-it, a kaizen event or a project.
- Write the funding case from projected future-state numbers. Convert days removed into inventory released.
- Name an owner, protect their hours and review monthly. Redraw the map as items close.
Change effort counts the roles a change touches
Change effort is the score most plans leave out. Count the roles whose daily work changes: operator, setup technician, scheduler, material handler, inspector, programmer. Then add one point each if the change needs training, a formal approval or IT work.
A total of 1 to 2 is low, 3 to 4 is medium and 5 or more is high. This is Webineering's working method, a practical scheme built on the acceptance findings above, and its cut-offs have no published validation. Count the person whose habits hold a step together as a role of their own; our article on tribal knowledge in manufacturing explains why that person changes the count.
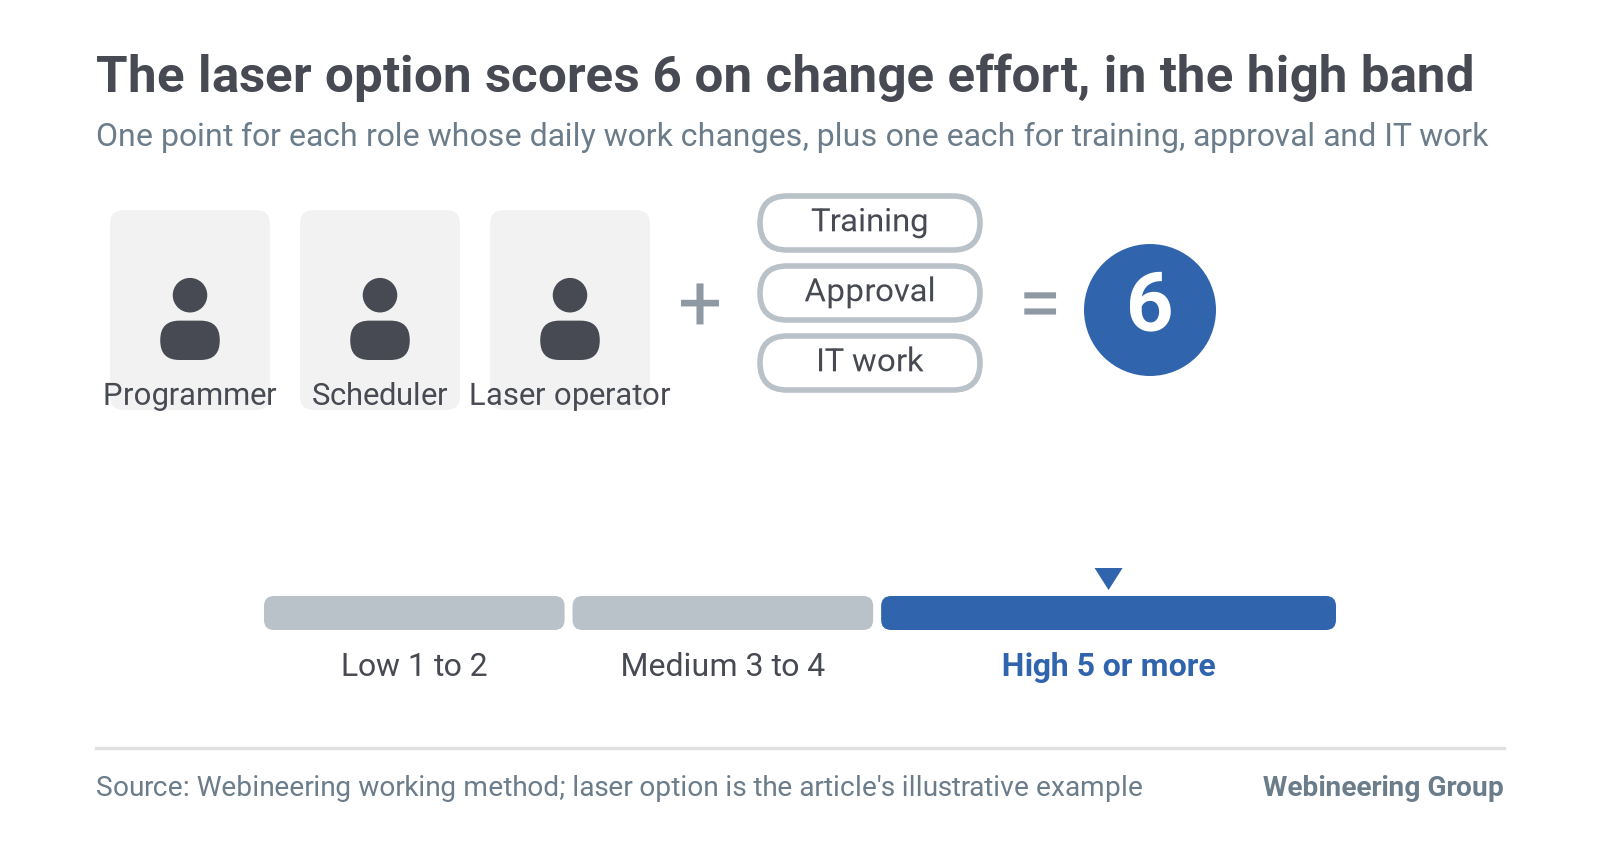
Score change effort with the people in those roles. A scheduler sees the weekly approval meeting a kit change would touch, which an engineer at the whiteboard can miss. If two people score the same option more than two points apart, talk it through before you rank it.
A PICK chart sorts the scored options
A PICK chart places each idea by payoff and difficulty in one of four boxes. The Public Health Foundation credits Lockheed Martin with developing it for Lean Six Sigma projects.
Adedeji Badiru and Marlin Thomas of the Air Force Institute of Technology proposed numeric scales for both axes in the Journal of Enterprise Transformation in 2013. They worked from an Air Force process improvement case.
Put days removed on the payoff axis and change effort on the difficulty axis. Size each bubble by cost band. Treat kill as kill for now, and revisit those options when capacity or priorities shift.
Then route each option. Karen Martin and Mike Osterling's transformation plan, from Value Stream Mapping (McGraw-Hill, 2014), lists an execution method for every item: just-do-it, kaizen event or project.
A just-do-it is a small, cheap, low-risk change one person can test this week. A project runs on a project plan and often carries capital or technology work.
Little's Law converts days removed into inventory released
Approvers fund in their own units: days of lead time, inventory and capacity. Little's Law links the first two. Average work in process equals the exit rate times the average time each job spends in the system.
Wallace Hopp and Mark Spearman treat it as a fundamental relationship in Factory Physics, first published in 1996. John Little and Stephen Graves of MIT show that it holds for long-run averages under steady-state conditions. At a steady exit rate, every day of lead time removed releases one day's output of work in process.
Picture a make-to-order fabrication flow, labeled here as an illustrative example. Jobs queue 1.33 working days at the saw, 2.00 at the laser, 3.00 at the brake, 4.00 at weld, 1.00 at inspection and 1.50 at paint. That's 12.83 days of queue.
Touch time is 84 minutes, or 0.10 of a two-shift, 840-minute working day. Lead time is therefore 12.93 working days. Daily demand is 30 jobs, so 12.93 × 30 = 387.9 jobs, call it 388, sit in process.
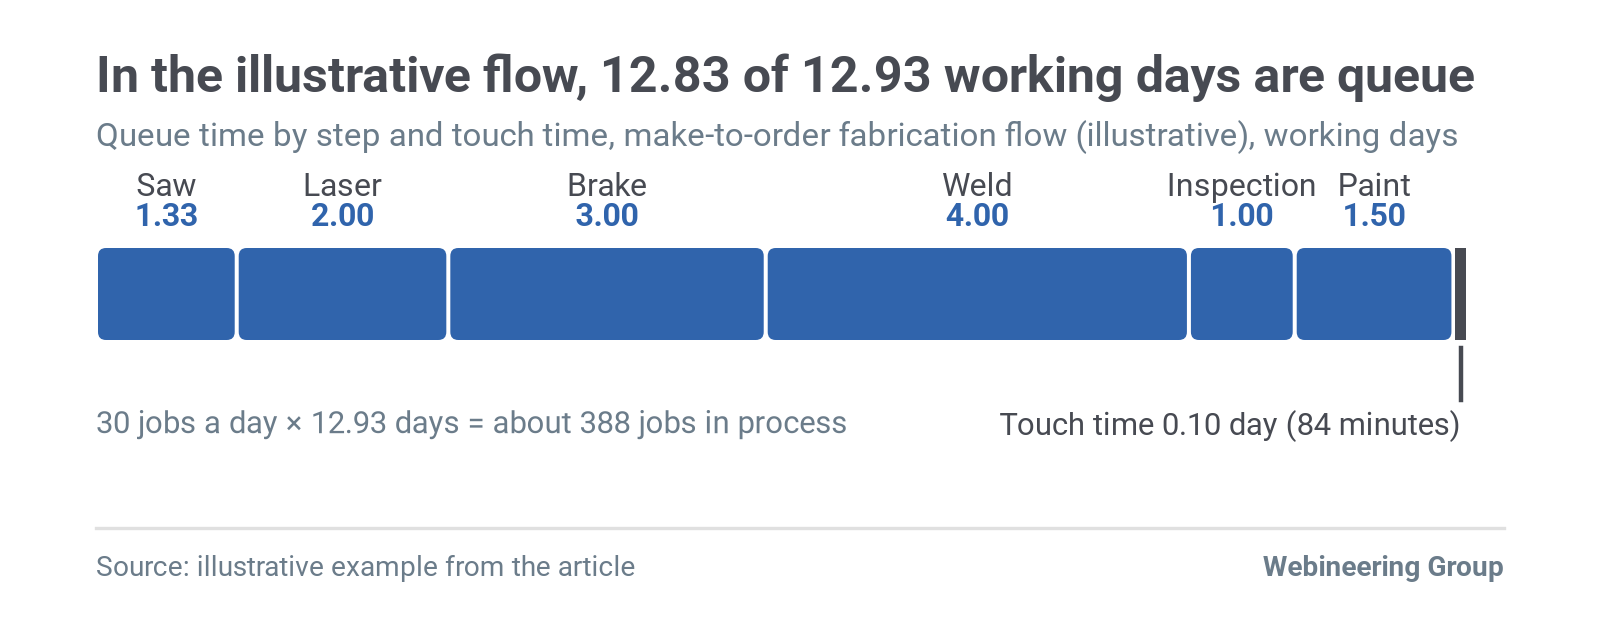
| Wait | Queue now (working days) | Option and lens | Illustrative reduction | Days removed | Cost band | Change effort | Jobs released (days × 30) | Route |
|---|---|---|---|---|---|---|---|---|
| Weld | 4.00 | Release daily kits in due-date order and cap the weld queue (rearrange) | Remove half | 2.00 | 1 | 4, medium: scheduler, weld lead, material handler, plus training | 60 | Kaizen event |
| Brake | 3.00 | Quick-release tooling so batches shrink (simplify) | Remove one third | 1.00 | 2 | 3, medium: brake operator, setup technician, plus training | 30 | Just-do-it |
| Laser | 2.00 | Nest and cut daily with reconfigured nesting software (eliminate the weekly batch, then automate) | Remove three quarters | 1.50 | 3 | 6, high: programmer, scheduler, laser operator, plus training, approval and IT | 45 | Project |
| Total | 9.00 | 4.50 | 135 |
All three changes take lead time from 12.93 to 8.43 working days. At the same 30 jobs a day, work in process drops from about 388 jobs to about 253, a release of 135 jobs.
The weld option removes 0.50 days per point of change effort. The brake option removes 0.33 and the laser project 0.25. Fund the weld change first, and put the laser project into the capital cycle now, because capital approvals move slowest.
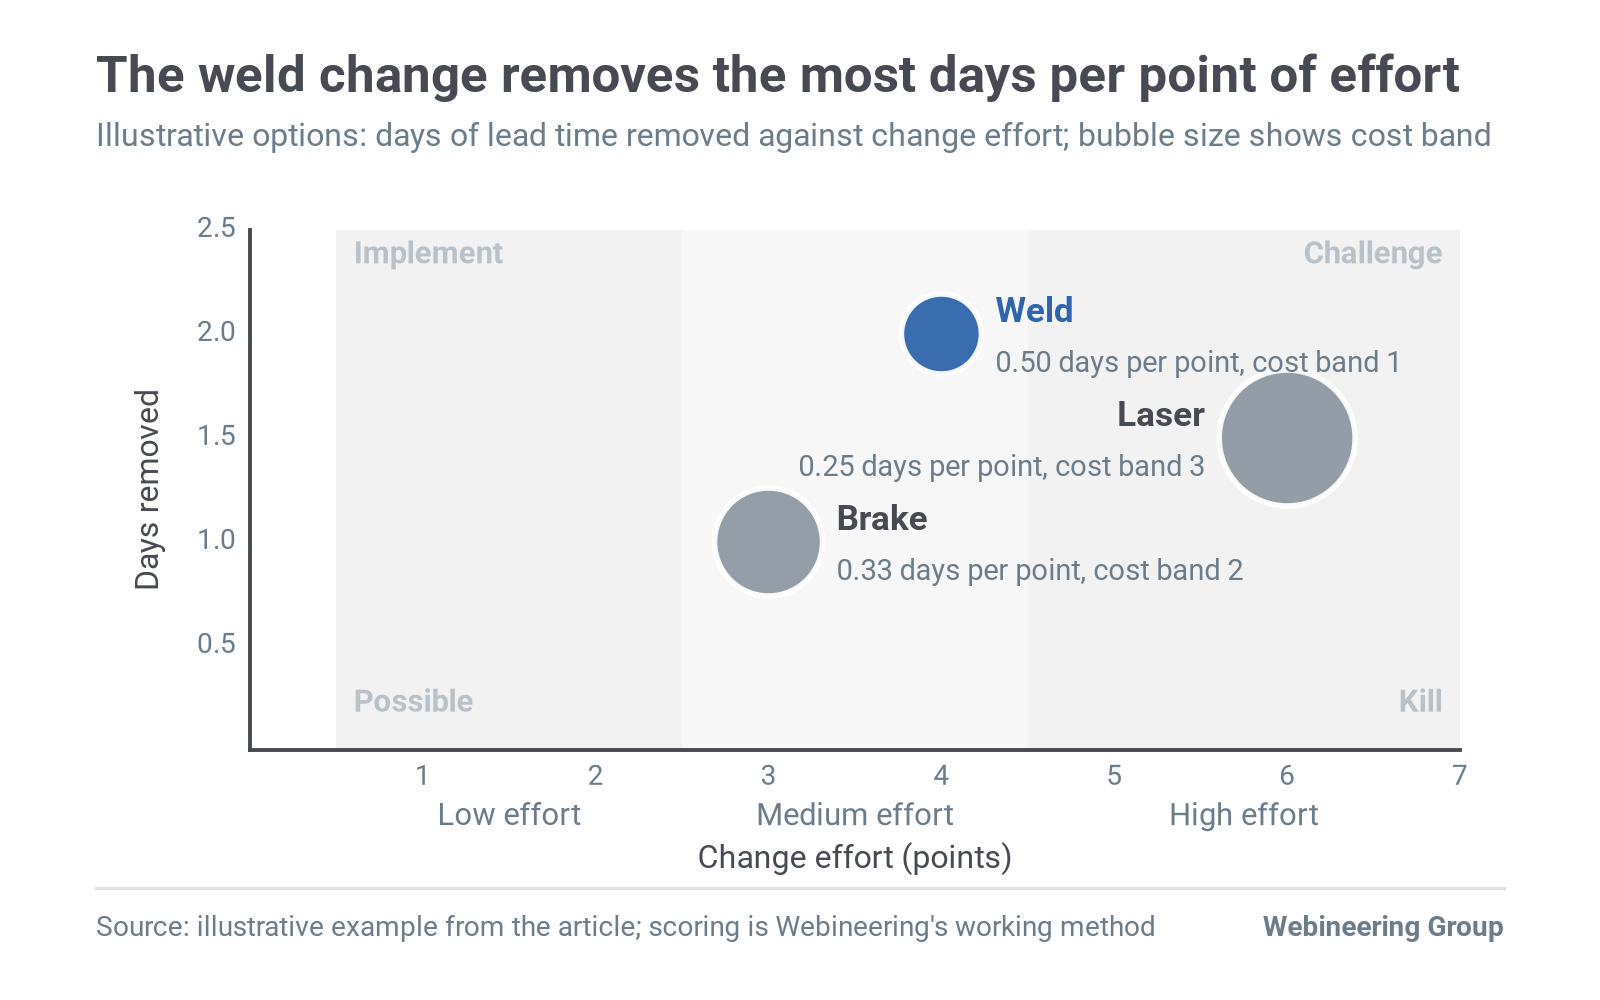
Write the funding case with three lines: days removed, jobs released and capacity freed. Capacity freed is the hours a step stops spending on batching, rework or searching, measured on the floor after the change.
Keep each number traceable. Days removed come from the timeline, jobs released from the Little's Law arithmetic and hours freed from a timed observation. An approver who can check each line in five minutes signs faster than one who has to trust a total.
Protected hours keep the plan alive
Every plan above stalls without hours. Tom Voss, writing "Value Stream Mapping: Lessons from the Front" for IndustryWeek in January 2015, advises assigning a project manager for each improvement area. He adds that the value stream plan "should be valid for no more than six months," after which the future-state map becomes the new current state.
Book the owner's hours as a standing calendar block, two a week at minimum for a kaizen-sized item. Our piece on how change initiatives lose momentum in week three covers what happens to unprotected hours. If the owner's calendar has no open two-hour block in the next three weeks, the item has no real funding yet, whatever the budget line says.
Review the map and the plan together each month. Redraw the map when items close, which keeps it alive in Abad's sense.
Four conditions call for a different first move
- High-mix, low-volume job shops. When one routing can't represent the flow, a single map misleads. Shahrukh Irani argued in ISE Magazine in April 2021 that high-mix, low-volume manufacturers "should quit using value stream mapping" and should use software to run a cluster analysis of the whole product mix. Treat that as one expert position and group products by routing before you map.
- No capacity to implement. If nobody can take protected hours this quarter, run the just-do-its only. Keep the rest scored and parked.
- The decision is already made. Once capital is approved for a specific machine, the map turns into a validation exercise. Score the remaining waits around that machine.
- Averages or guesses in the current state. Abad warns that teams fall back on averages when real information is missing. Rui Sousa, José Dinis-Carvalho and Peter Hines list inventory quantification among six recurring value stream mapping problems in Production Engineering Archives in 2026. Re-observe before you score.
Start these five on Monday
- Pull your last map and count the bursts that became funded projects.
- Convert the three largest waits into days of lead time.
- Write two options for the largest wait, in eliminate, combine, rearrange, simplify, automate order.
- Count the roles each option changes, and add one each for training, approval and IT.
- Book two protected hours a week for the owner of the top item.
Get one value stream scored and ranked
Webineering's fixed-fee site assessment reviews floor processes, records and reports for one value stream. You get one written report with ranked improvement opportunities you can take into your next budget meeting.
Site assessment
Want to see where your own line stands?
An evidence-backed report on where real value lies, from the people who stay through implementation.
Authors
Anthony Occidentale
Principal
Founder